Dividends, stocks, dividend portfolios and tracking
Dividend Portfolios
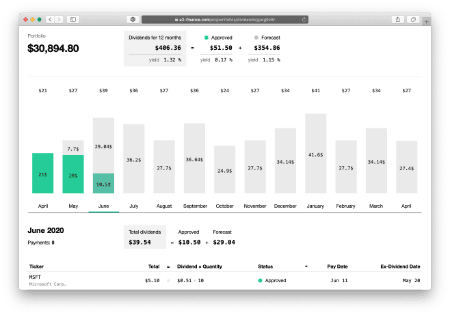
The dividend portfolio shows how many dividends you can obtain in the next 12 months. This is a very simple forecast, but allows for an understanding of the whole picture, and also helps you properly direct your cash flow (similarly to a bond's coupon).
In addition, the tool can also compile share portfolios that will yield dividends every month.
Yes, this year many companies abolished dividends, therefore the forecast can occasionally be erroneous, but things will improve, right?
Sample Portfolio New portfolio
Best dividend companies
🇺🇸 USA
| DY | |||
|---|---|---|---|
| 🏆 | Home Depot | 2.6 % | |
| 🥈 | AbbVie | 4.5 % | |
| 🥉 | Union Pacific | 2.6 % | |
| Medtronic | 3.1 % | ||
| Amgen | 2.7 % | ||
| U.S. Bancorp | 3.8 % | ||
| Altria | 7.4 % | ||
| Illinois Tool Works | 2.6 % | ||
| Colgate-Palmolive | 2.4 % | ||
| Schlumberger NV | 2.4 % |
🇯🇵 Japan
| DY | |||
|---|---|---|---|
| 🏆 | Japan Tobacco | 2.3 % | |
| 🥈 | Sekisui House | 2.1 % | |
| 🥉 | Ono Pharmaceutical | 2.3 % | |
| Isuzu Motors | 2.5 % | ||
| Meiji | 2.7 % | ||
| Koei Tecmo | 2.3 % | ||
| Tosoh | 2.3 % | ||
| NSK | 2.2 % | ||
| NH Foods | 2.7 % | ||
| DIC | 4.1 % |
🇬🇧 UK
| DY | |||
|---|---|---|---|
| 🏆 | LUKOIL | 5.4 % | |
| 🥈 | EVN | 4.1 % | |
| 🥉 | Loomis | 3.8 % | |
| Fuchs Petrolub | 3.0 % | ||
| Keurig Dr Pepper | 0.7 % | ||
| Princess Private Equity | 3.4 % | ||
| Tufton Oceanic Assets | 2.2 % | ||
| Bouvet | 1.2 % | ||
| Toyota Motor | 2.2 % | ||
| Ashtead | 0.0 % |
🇩🇪 Germany
| DY | |||
|---|---|---|---|
| 🏆 | GEA Group | 3.5 % | |
| 🥈 | Jungheinrich | 2.1 % | |
| 🥉 | JOST Werke | 2.8 % | |
| Merkur Bank | 2.7 % | ||
| Bastei Lübbe | 5.6 % | ||
| Andritz | 6.7 % | ||
| Siemens | 5.6 % | ||
| Siemens | 5.6 % | ||
| Vossloh | 3.6 % | ||
| Fuchs Petrolub | 3.4 % |
Top 10 upcoming dividends this week
all upcoming dividends are listed here| Ticker | Company | Trailing Yield | Forward Yield | Ex-Dividend Date | Close Price | Market Capitalization |
|---|---|---|---|---|---|---|
| BLX | Banco Latinoamericano de Comercio Exterior SA | 23.15 % | 5.09 % | Feb 23 | $13.5 | 648 M |
| HTGC | Hercules Capital | 13.42 % | 3.35 % | Feb 25 | $14.01 | 2 B |
| GSL | Global Ship Lease | 13.08 % | 3.85 % | Feb 24 | $16.24 | 847 M |
| DX | Dynex Capital | 12.50 % | 12.62 % | Feb 23 | $16.16 | 629 M |
| DHT | DHT Holdings | 12.17 % | 6.74 % | Feb 19 | $6.08 | 932 M |
| TLF | Tandy Leather Factory | 9.94 % | 3.31 % | Feb 25 | $22.63 | 27 M |
| RHI | Robert Half International | 9.51 % | 2.38 % | Feb 25 | $24.81 | 13 B |
| AB | AllianceBernstein Holding LP | 8.23 % | 2.28 % | Feb 20 | $42.15 | 5 B |
| PSEC | Prospect Capital | 7.53 % | 7.53 % | Feb 25 | $7.17 | 3 B |
| BP | BP | 6.91 % | 1.75 % | Feb 20 | $28.28 | 86 B |
Calculators
Stocks and bonds
Investing
Dividends
Reviews
超愛這個網站的圖表~.
강력한 계산기능과 더 나은 디자인 그리고 캘린더와 배당 포트폴리오 짜기에도 훨씬 편리한 곳이 있습니다. 엑셀파일로의 추출까지 지원합니다. 배당일 카운트다운 기능도 있어서 재미도 있습니다.
I was pleased to see that a lot of information was published for free. I didn't immediately understand where the dividend portfolios were, but after a few minutes I found them.
Идеально для новичков вроде меня, которые только присматриваются к такому способу заработка.


